Instructions:
Let’s build a kNN model using the college completion data from last week. The data is messy and you have a degrees of freedom problem, as in, we have too many features.
You’ve done most of the hard work already, so you should be ready to move forward with building your model.
Use the question/target variable you submitted from last week and build a model to answer the question you created for this dataset.
Build and optimize a kNN model to predict your target variable. Meaning use the tune set to select the correct k value.
Experiment with the threshold function, what happens at higher and lower thresholds. Document what you see in comments.
Evaluate the results using the confusion matrix (at the default threshold). Then talk through your question, summarize what concerns or positive elements do you have about the model?
Bonus: Adjust the function that selects k to output on Specificity instead of Accuracy
Example of how I cleaned the data
readme for the dataset - https://
import pandas as pd

grad_data = pd.read_csv('https://query.data.world/s/qpi2ltkz23yp2fcaz4jmlrskjx5qnp', encoding="cp1252")
# the encoding part here is important to properly read the data! It doesn't apply to ALL csv files read from the web,
# but it was necessary here.
grad_data.info()
<class 'pandas.core.frame.DataFrame'>
RangeIndex: 3798 entries, 0 to 3797
Data columns (total 62 columns):
# Column Non-Null Count Dtype
--- ------ -------------- -----
0 unitid 3798 non-null int64
1 chronname 3798 non-null object
2 city 3798 non-null object
3 state 3798 non-null object
4 level 3798 non-null object
5 control 3798 non-null object
6 basic 3798 non-null object
7 hbcu 94 non-null object
8 flagship 50 non-null object
9 long_x 3798 non-null float64
10 lat_y 3798 non-null float64
11 site 3779 non-null object
12 student_count 3798 non-null int64
13 awards_per_value 3798 non-null float64
14 awards_per_state_value 3798 non-null float64
15 awards_per_natl_value 3798 non-null float64
16 exp_award_value 3798 non-null int64
17 exp_award_state_value 3798 non-null int64
18 exp_award_natl_value 3798 non-null int64
19 exp_award_percentile 3798 non-null int64
20 ft_pct 3794 non-null float64
21 fte_value 3798 non-null int64
22 fte_percentile 3798 non-null int64
23 med_sat_value 1337 non-null float64
24 med_sat_percentile 1337 non-null float64
25 aid_value 3797 non-null float64
26 aid_percentile 3797 non-null float64
27 endow_value 2323 non-null float64
28 endow_percentile 2323 non-null float64
29 grad_100_value 3467 non-null float64
30 grad_100_percentile 3467 non-null float64
31 grad_150_value 3467 non-null float64
32 grad_150_percentile 3467 non-null float64
33 pell_value 3797 non-null float64
34 pell_percentile 3797 non-null float64
35 retain_value 3535 non-null float64
36 retain_percentile 3535 non-null float64
37 ft_fac_value 3785 non-null float64
38 ft_fac_percentile 3785 non-null float64
39 vsa_year 279 non-null float64
40 vsa_grad_after4_first 279 non-null float64
41 vsa_grad_elsewhere_after4_first 279 non-null float64
42 vsa_enroll_after4_first 279 non-null float64
43 vsa_enroll_elsewhere_after4_first 279 non-null float64
44 vsa_grad_after6_first 279 non-null float64
45 vsa_grad_elsewhere_after6_first 279 non-null float64
46 vsa_enroll_after6_first 279 non-null float64
47 vsa_enroll_elsewhere_after6_first 279 non-null float64
48 vsa_grad_after4_transfer 270 non-null float64
49 vsa_grad_elsewhere_after4_transfer 270 non-null float64
50 vsa_enroll_after4_transfer 270 non-null float64
51 vsa_enroll_elsewhere_after4_transfer 270 non-null float64
52 vsa_grad_after6_transfer 270 non-null float64
53 vsa_grad_elsewhere_after6_transfer 270 non-null float64
54 vsa_enroll_after6_transfer 270 non-null float64
55 vsa_enroll_elsewhere_after6_transfer 270 non-null float64
56 similar 3579 non-null object
57 state_sector_ct 3798 non-null int64
58 carnegie_ct 3798 non-null int64
59 counted_pct 3372 non-null object
60 nicknames 310 non-null object
61 cohort_size 3467 non-null float64
dtypes: float64(40), int64(10), object(12)
memory usage: 1.8+ MB
grad_data.shape---------------------------------------------------------------------------
NameError Traceback (most recent call last)
Cell In[1], line 1
----> 1 grad_data.shape
NameError: name 'grad_data' is not defined# We have a lot of data! A lot of these have many missing values or are otherwise not useful.
to_drop = list(range(39, 56))
to_drop.extend([27, 9, 10, 11, 28, 36, 60, 56])grad_data1 = grad_data.drop(grad_data.columns[to_drop], axis=1)
grad_data1.info()<class 'pandas.core.frame.DataFrame'>
RangeIndex: 3798 entries, 0 to 3797
Data columns (total 37 columns):
# Column Non-Null Count Dtype
--- ------ -------------- -----
0 unitid 3798 non-null int64
1 chronname 3798 non-null object
2 city 3798 non-null object
3 state 3798 non-null object
4 level 3798 non-null object
5 control 3798 non-null object
6 basic 3798 non-null object
7 hbcu 94 non-null object
8 flagship 50 non-null object
9 student_count 3798 non-null int64
10 awards_per_value 3798 non-null float64
11 awards_per_state_value 3798 non-null float64
12 awards_per_natl_value 3798 non-null float64
13 exp_award_value 3798 non-null int64
14 exp_award_state_value 3798 non-null int64
15 exp_award_natl_value 3798 non-null int64
16 exp_award_percentile 3798 non-null int64
17 ft_pct 3794 non-null float64
18 fte_value 3798 non-null int64
19 fte_percentile 3798 non-null int64
20 med_sat_value 1337 non-null float64
21 med_sat_percentile 1337 non-null float64
22 aid_value 3797 non-null float64
23 aid_percentile 3797 non-null float64
24 grad_100_value 3467 non-null float64
25 grad_100_percentile 3467 non-null float64
26 grad_150_value 3467 non-null float64
27 grad_150_percentile 3467 non-null float64
28 pell_value 3797 non-null float64
29 pell_percentile 3797 non-null float64
30 retain_value 3535 non-null float64
31 ft_fac_value 3785 non-null float64
32 ft_fac_percentile 3785 non-null float64
33 state_sector_ct 3798 non-null int64
34 carnegie_ct 3798 non-null int64
35 counted_pct 3372 non-null object
36 cohort_size 3467 non-null float64
dtypes: float64(18), int64(10), object(9)
memory usage: 1.1+ MB
# drop even more data that doesn't look predictive
drop_more = [0,2,3,6,8,11,12,14,15,18,21,23,29,32,33,34,35]
grad_data2 = grad_data1.drop(grad_data1.columns[drop_more], axis=1)
grad_data2.info()
<class 'pandas.core.frame.DataFrame'>
RangeIndex: 3798 entries, 0 to 3797
Data columns (total 20 columns):
# Column Non-Null Count Dtype
--- ------ -------------- -----
0 chronname 3798 non-null object
1 level 3798 non-null object
2 control 3798 non-null object
3 hbcu 94 non-null object
4 student_count 3798 non-null int64
5 awards_per_value 3798 non-null float64
6 exp_award_value 3798 non-null int64
7 exp_award_percentile 3798 non-null int64
8 ft_pct 3794 non-null float64
9 fte_percentile 3798 non-null int64
10 med_sat_value 1337 non-null float64
11 aid_value 3797 non-null float64
12 grad_100_value 3467 non-null float64
13 grad_100_percentile 3467 non-null float64
14 grad_150_value 3467 non-null float64
15 grad_150_percentile 3467 non-null float64
16 pell_value 3797 non-null float64
17 retain_value 3535 non-null float64
18 ft_fac_value 3785 non-null float64
19 cohort_size 3467 non-null float64
dtypes: float64(12), int64(4), object(4)
memory usage: 593.6+ KB
grad_data2.head()import numpy as np
grad_data2.replace('NULL', np.nan, inplace=True)grad_data2['hbcu'] = [1 if grad_data2['hbcu'][i]=='X' else 0 for i in range(len(grad_data2['hbcu']))]
grad_data2['hbcu'].value_counts()0 3704
1 94
Name: hbcu, dtype: int64grad_data2['hbcu'] = grad_data2.hbcu.astype('category')# convert more variables to factors
grad_data2[['level', 'control']] = grad_data2[['level', 'control']].astype('category')# In R, we convert vals to numbers, but they already are in this import
grad_data2.info()<class 'pandas.core.frame.DataFrame'>
RangeIndex: 3798 entries, 0 to 3797
Data columns (total 20 columns):
# Column Non-Null Count Dtype
--- ------ -------------- -----
0 chronname 3798 non-null object
1 level 3798 non-null category
2 control 3798 non-null category
3 hbcu 3798 non-null category
4 student_count 3798 non-null int64
5 awards_per_value 3798 non-null float64
6 exp_award_value 3798 non-null int64
7 exp_award_percentile 3798 non-null int64
8 ft_pct 3794 non-null float64
9 fte_percentile 3798 non-null int64
10 med_sat_value 1337 non-null float64
11 aid_value 3797 non-null float64
12 grad_100_value 3467 non-null float64
13 grad_100_percentile 3467 non-null float64
14 grad_150_value 3467 non-null float64
15 grad_150_percentile 3467 non-null float64
16 pell_value 3797 non-null float64
17 retain_value 3535 non-null float64
18 ft_fac_value 3785 non-null float64
19 cohort_size 3467 non-null float64
dtypes: category(3), float64(12), int64(4), object(1)
memory usage: 516.0+ KB
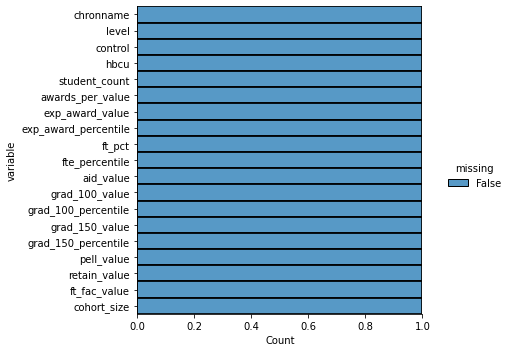
# check missing data
import seaborn as sns

sns.displot(
    data=grad_data2.isna().melt(value_name="missing"),
    y="variable",
    hue="missing",
    multiple="fill",
    aspect=1.25
)
<seaborn.axisgrid.FacetGrid at 0x7fc9593cd340>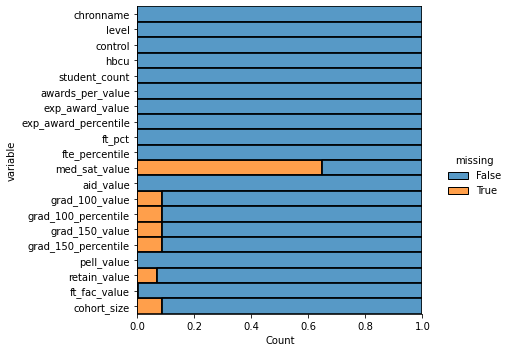
#let's drop med_stat_value then delete the rest of the NA rows
grad_data2 = grad_data2.drop(grad_data[['med_sat_value']], axis=1)
grad_data2.dropna(axis = 0, how = 'any', inplace = True)
sns.displot(
data=grad_data2.isna().melt(value_name="missing"),
y="variable",
hue="missing",
multiple="fill",
aspect=1.25
)<seaborn.axisgrid.FacetGrid at 0x7fc9598f06d0>